Collegiate Sports Paging System
Test Evaluation Summary
Version 1.0
Revision History
|
Date |
Version |
Description |
Author |
| November 17, 1999 | 1.0 | Initial version | Context Integration |
Table of Contents
Introduction 
Purpose
This Test Evaluation Report describes the results of the tests in terms of test coverage (both requirements-based and code-based coverage) and defect analysis (i.e. defect density).
Scope
This Test Evaluation Report applies to the first Construction Iteration of the . The tests conducted are described in the Test Plan for the first Construction Iteration. This Evaluation Report is to be used for the following:
- assess the acceptability and appropriateness of the performance behavior(s) of the prototype,
- assess the acceptability of the tests, and
- identify improvements to increase test coverage and / or test quality.
Definitions, Acronyms and Abbreviations
See Glossary.
References
Test Results Summary 
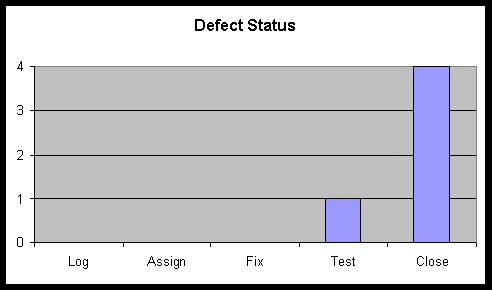
The test cases defined in the Test Model were executed following the test strategy as defined in the Test Plan. The test defects have been logged and any medium, high, or critical priority defects are currently assigned to the owner for fixing.
Test coverage (see Section 3 below) in terms of covering the use cases and test requirements defined in the Test Plan was 100% complete.
Code coverage was measured using Rational Visual PureCoverage and is described in Section 4.
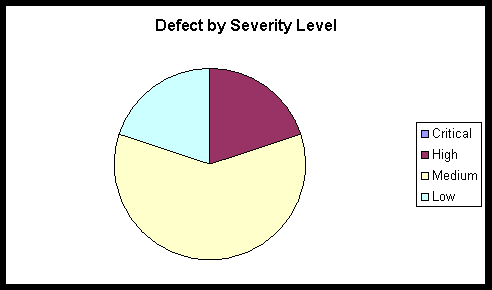
Analysis of the defects (as shown in Section 6 below) indicates that the majority of found defects tend to be minor problems classified as low or medium in severity. The other significant finding was that software components comprising the interface to the Pager Gateway contained the highest number of defects.
Test Coverage 
All test cases not relating to advertising content, as defined in the Test Model, were attempted. Of the tests cases executed, 5 tests failed.
The test coverage results are as follows:
- Ratio Test Cases Performed = 80/80= 100%
- Ratio Test Cases Successful = 75/80 = 93.75%
The area of tests with the highest failure rate was the Pager Gateway Interface, which failed under high volume testing.
Further detail on test coverage is available using Rational RequisitePro and the Test Case matrix.
Code Coverage 
Rational Visual PureCoverage was used to measure code coverage of the tests.
Ratio LOC executed = 94,399 / 102,000 = 93%
Approximately, 93% of the code was executed during the testing. This coverage exceeded the target of 90%.
Suggested Actions 
The following actions are recommended to improve performance to an acceptable level:
- Implement a multi-tiered Pager Gateway system to provide increased scalability. This will require additional hardware to be installed by WebNewsOnLine.
Diagrams 


Copyright © 1987 - 2001 Rational Software Corporation