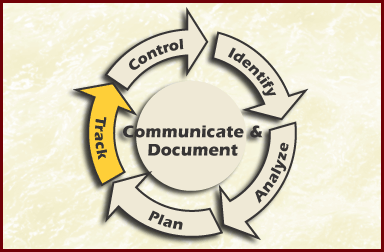

Figure Track Risk Management Paradigm
The risk management team will use the risk information sheet to indicate what information will be gathered during the track phase of the paradigm. The shaded areas in Figure Risk Information Sheet Before Track indicate the fields, which the risk team members will be complete and/or updated during track:
| ID 11 | Risk Information SheetBefore Track | Identified:_9/_1/_02_ | ||||||
| Priority
Probability Impact |
7
M M |
Statement has recently been decided that the Infrared sensors will be developed in-house and how they will communicate and how sensor data will be processed will be based on assumptions until the detailed design is baselined; the accuracy and completeness of those assumptions will determine the magnitude of change in the IR-SIP Instrument Controller CI and Infrared Sensing Unit CI interface requirements - it could be minor or catastrophic. | ||||||
| Timeframe | N | Originator | Class Requirements | Assigned To: | ||||
Context The AA
program is in the Systems Preliminary Design Phase and the IR-SIP project
software is in the Software Specification Phase.
|
||||||||
| Approach:Research/
Accept/ Watch/ Mitigate Mitigation goal/success measures: Reduce the probability and impact of incorrect interface assumptions to a minimum: estimated low probability and low impact. Ideally, completion of prototype tests will show that assumptions we got from EasySensor were correct and there is no impact at all.]
|
||||||||
Contingency Plan and Trigger
|
||||||||
| Status | Status Date | |||||||
| |
|
|||||||
| |
|
|||||||
| |
|
|||||||
| |
|
|||||||
| |
|
|||||||
| Approval __________________________ | Closing Date __/__/__ |
Closing Rationale
|
||||||
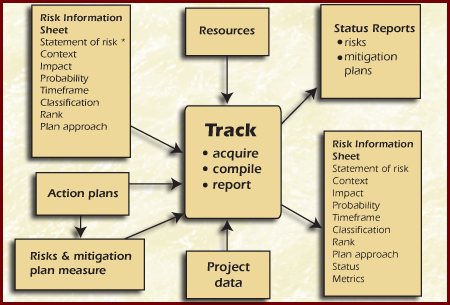
Figure Track Function
| Data Item |
Description |
| Risk statement Context Impact Probability Timeframe Classification Rank Plan Approach |
Prior to tracing, the risk information for each risk
comprises the statement of risk, supporting context, impact, probability,
timeframe, class,, rank, and plan approach. This could be for all of the
risks or for a small subset of risks targeted for risk tracking. |
| Action plans |
Action plans describe what action will be taken to deal
with the Risk. Mitigation plans and tracking requirements for watched
risks identify the measures, indicators, and triggers to track both the
statuses of the risks and the mitigation progress. |
| Risk & mitigation plan measures |
These consist of the current values for all watched-risk
and mitigation-plan measures and indicators. These data can be used to
determine the current status of the risk action plan and can be compiled
and presented as part of a report. |
| Resources |
These are the available resources for mitigation. In
order to develop effective status reports, project personnel need to know
the limits of the available resources to mitigate and watch risks. |
| Project data |
Project information, such as schedule and budget
variances, critical path changes, and project/performance indicators can
be used as triggers, thresholds, and risk- or plan-specific measures where
appropriate. This data can be used to determine the current status of the
project plan as it relates to risk management and can be compiled and
presented as part of a status report. |
| Status reports Risks plans Mitigation plans |
The output of tracking is a variety of status reports
highlighting the current values of the risk indicators and the statuses of
action plans. These reports can be verbal or written, covering the status
of both individual risks and aggregated risk areas as appropriate. |
| Risk statement Context Impact Probability Timeframe Classification Rank Plan Approach Status |
In addition to the delivery of status reports, tracking
updates the information associated with each risk to include the current
status data for the risk (e.g.. measure, indicator, and trigger values).
|
Coordination of Tracking and Control Risk tracking and control should be closely coordinated, because decisions that are made about risks and action plans during control require the data that are collected during tracking. Example: The decision of whether to continue tracking a risk or to close it is made by project personnel during control, based on the data acquired during tracking. Tracking and Control vs. Project Management Risk tracking and control are closely related to standard project management monitoring techniques in which project data, such as schedule and cost data, are tracked. Project decisions are then based on the tracked data. When appropriate, the data used for risk management can be integrated and coordinated with existing project management activities for a project or organization. Standard project management techniques that are already being used on a project can also be employed to monitor the risk management processes (e.g., the number of risks opened and closed, changes to the risk management plan, etc.). Sets of Related Risks During risk identification and analysis, risks that are related can be grouped together for easier management; they can also be tracked as a set. If an overall plan has been developed for the set, then the set's mitigation plan is tracked, and risk and plan status data are reported as an aggregate. However, any individually critical risks can also be tracked separately from the set. Approaches There are not many tools specifically designed for tracking risks. Rather, there are approaches for tracking risks, which utilize existing, general methods and tools. The Table Track Approach summarizes the approaches used to support each of the tracking activities. More details on the approaches can be found in subsequent sections of this chapter and in the appendix chapters.
Table Track Approach
| Activity | Approach | Method or Tool |
| Acquire |
|
Binary attribute evaluation Tri-level attribute |
| Compile |
Data are analyzed and compiled into status reports
according to the project's reporting requirements. This is the step where
trends are examined. Reporting approaches supported by the compile
activity may include any of the following:
|
Bar graph Mitigation status report Risk information sheet Spreadsheet risk tracking Stoplight chart Time correlation chart Time graph |
| Report |
|
Mitigation status report
Risk information sheet Spreadsheet risk tracking Stoplight chart |
Program and risk metrics provide the risk manager and risk team members with the information needed to make effective decisions. A program manager uses program metrics to assess the cost and schedule of a program as well as the performance and quality of a product. They can also be used to help Identify and Track risks. We have used metrics to:
During the Track phase a program metric should be used to look at the rate of a hardware or software module completion schedule. If this metric indicates that the rate of completion is lower than expected, then a schedule risk can be identified and a trigger raised. Risk metrics are also used to measure a risk�s attributes and assess the progress of a mitigation or task plan.
We can also use the Figure Metrics by Life Cycle Phases to identify where to collect metrics during the life cycle phases. The darker borders in the figure are the phases where metrics can be used to track risks.
Metrics can be used to identify new risks within each phase of the life cycle as well as across all phases of project development, which includes maintenance and sustaining engineering. Program metrics collected during the development process requires tracking at the schedule and budget. The schedule is both personnel and funding. The rate of component completion is program metrics collection that must also be tracked. During the requirements phase, the text of the requirements document, the requirements changes, and requirements-to-test mappings are examples of program metrics to be collected. The requirements-to-test mappings are the requirements that trace to the test cases that the testing personnel use to verify and validate that the requirements are met. Metrics are kept during the testing phase. During the testing phase metrics are collected on when and where errors are detected. This includes unit testing, integration testing, subsystem testing, integration, and installation testing. During Maintenance metrics are collected to know which modules are being changed and the change schedule.
It is important to evaluate the requirements as early as possible in the development process since requirement problems not identified until testing can cost 100 times more. The Case Study recognized requirement risks stating the initial system requirements are insufficient and unknowns would not be fired up until late in the project. This is the Risk ID7 that stated the science software is expected to have substantial TBDs (to be determined).
The following are example of metrics to observe by lifecycle phase and collected for the project documentation:
There are tools available to automatically collect metrics directly from documents. The tool Automated Requirements Measurement (ARM) automatically derives metrics from the text of a requirements document. The tool is available at no cost through the SATC homepage-tool section. http://satc.gsfc.nasa.gov/tools/arm
During requirements the use of weak phrases (e.g., adequate, appropriate, etc.) and options (e.g., can, may, etc.) leads to requirements ambiguity. The completeness of requirements can be measured by counting the number of TBDs (to be determined), TBAs (to be added), and the TBRs (to be resolved) contained in the requirements document.
Traceability is a term used to indicate the number of items that can be traced between the requirement specifications and the detailed design document. Tracing down ensures that all of the requirements in the specification are documented in the detailed design document. Tracing up ensures that all requirements that are in the detailed design document can be traced to requirements in the requirement specifications (i.e., no additional requirements were added in the detailed design document). The requirement specifications also should trace to the test documents and the verification and validation documents. Theoretically the software engineer should never leave the requirements phase and start the design phase with TBDs remaining.
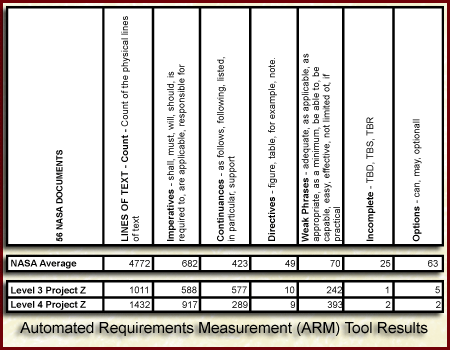
Figure Requirements Metrics Example - Text Analysis is the result of a textual analysis of 56 software requirement documents. ARM was used to evaluate other project document such as design, code, and test documents. It could be used to identify requirements that may not be testable due to weak phrases and options, like the word normal, fast etc.
During Track other metrics that could be collected relate to the software or hardware testing. The risk statement in Risk ID100: Project resources and schedules were underestimated; schedule slips, cost overruns, testing time inadequate. Will be used as an example to obtain tracking indicators from.
The test engineers must collect and track at a minimum the following two pieces of information about errors (also called Bugs). The two are: Open/closed rate of errors and Number of errors per module of code. These trace back and relate to schedule risks and code reliability/maintainability.
Open/closed rate of errors
The rate in which errors (bugs) are found and resolved (fixed) is important to know for scheduling purposes. The rate in which errors are found should decrease as testing nears its conclusion. A continual rate of closure is necessary to ensure that the errors are being resolved in a timely fashion. This concept relates to Risks concerned with testing resources and schedule such as ID 6 and ID 21 & ID100
Errors per module of code
It is important to correlate all errors to the modules that were changed. An excessive number of errors for a module indicate that there may have been multiple changes to the original structure and that the module�s integrity may be compromised. In Case Study, since requirement completeness is a risk, a high number of changes in a specific module may indicate an area of requirement instability. The changes made to a module should be indicated by comments in the code. This concept relates to Risks such as #101, C++ and OOD usage
Figure Testing Metrics Example - Tracking Errors/Faults/Changes
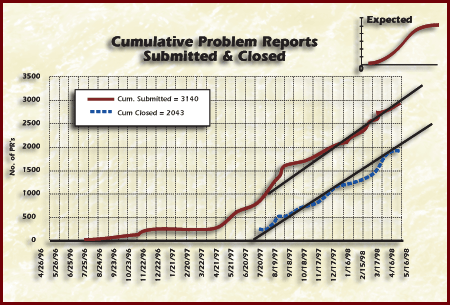
In the Figure Testing Metrics Example - Tracking Errors/Faults/Changes, the graph on the left shows that the rate of closure is inconsistent over time. With Testing ending in three months, the number of errors being found should decrease and closure rate should exceed open rate. The graph on the right shows the number of changes per module.
A process metrics example can be obtained form Risk ID 6. Risk ID 6: Project software schedule and resources were underestimated; schedule slips, reduction in adequate testing time. The data the project manager should collect is the effort per activity. Effort is also means man-hours. The project manager should establish the trigger to look for when effort exceeds an expected percentage.
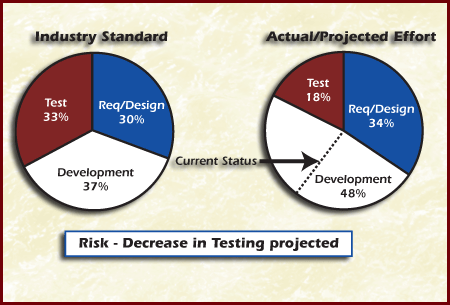
The Figure Process Metrics Example Effort per Life Cycle Phase can be applied to track risks, this type of graph assists in evaluation schedule and testing risks. The graph on the left is an industry guideline for effort per phase [Grady 92]. In the project data on the right graph, notice that the development time far exceeds the projected development time, causing a substantial decrease in testing time. The current status line shows where the project is now, with the remaining information being projected. The risk to sufficient test time is high. A risk measure (which is synonymous with metric [Baumert 92]) defines a standard way; of measuring some attribute of the risk management process. Risk and mitigation plan measures can be qualitative or quantitative. Example: The values of the risk attributes, e.g., the impact of a risk and the probability o a risk occurring, are examples of risk measures.- Indicators are representations of measurement data that provide insight into a process oi improvement activity [Baumert 92]. They can be used to show status and, in this document, are also called status indicators. Indicators may use one or more measures, and the; can give a more complex measure of the risk and mitigation plan. In the following diagram, a measure from Risk A as well as two measures from tasks in the mitigation plan is used to create Status Indicator B. Triggers are thresholds for indicators that specify when an action, such as implementing a contingency plan, may need to be taken. Triggers are generally used to
Trigger Example 1 A given risk on a project is the following: Not all developers are trained in the new compiler; delivery of coded modules may be delayed. This example is related to the previous diagram. Measure M3 is the number of developer; trained each week; M4 is the schedule of milestones indicating the beginning of development for each module; and M5 is the number of developers required for each module. The combination of M3, M4, and M5 yields Status Indicator B, which is the available number of trained developers for modules under development. Project personnel could define the trigger in this example to be the point at which the number of available trained developers is 10% below the required number. Trigger Example 2 During Plan, indicators may be chosen to track risks and mitigation plans, Acceptable values or limits (i.e., thresholds/triggers) for the indicator values can also be determined.If the value of an indicator rises above the trigger value, this provides valuable information to the risk manager or project manager that control action should be considered. Triggers should provide risk manager or project manager with meaningful information to enable more informed control decisions.An effective trigger will give risk personnel enough time to take appropriate action or to focus extra attention on a risk.
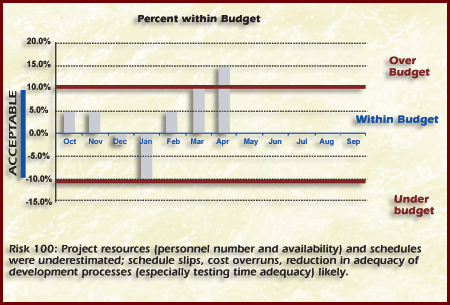
Figure Triggers Percent Within Budget
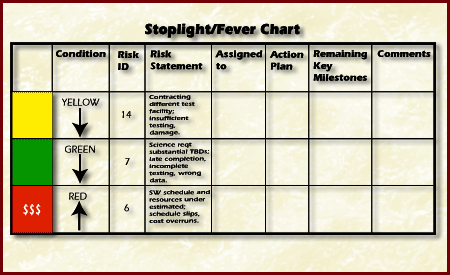
Figure Stoplight or Fever Chart Indicator
Stoplight charts provide a means of communicating the status of risk mitigation actions.They indicate to the decision-maker how well the current plans are doing and whether or not management action is required.
| Risk Statement: No
simulation of the system's display performance has been done we may not
meet the performance requirements.
|
| Context: During the
initial phases of planning, a high-fidelity' performance simulation of the
system was defined but was cut due to budget considerations. Nothing was
substituted, not even a limited low-fidelity simulation or an
order-of-magnitude analysis. We have implemented 20% of the screen display
code, and it already takes 30% of the total available frame-time for
updating the sensor displays. No one is monitoring the performance.
|
Risk Example Data In this example, attribute values are estimated based on
the AFSC/AFLC Pamphlet 800-45 [Air Force 88].From the risk's impact and
probability attribute values, project personnel determine the level of risk
exposure, which will be one of the indicators used to track the risk.Next,
personnel determine the trigger value for risk exposure. For this particular
risk, additional measures are used to calculate a second indicator, "frametime
used/code complete ratio," and project personnel determine a trigger for that
indicator as well.The measures, indicators, and triggers and their values for
this example are shown in Table Measures, Indicators, and Triggers.
Table Measures, Indicators, and Triggers
| Data |
Type |
Value/Description |
| Probability |
Measure |
Probable |
| Impact |
Measure |
Critical |
| Risk exposure |
Indicator |
Moderate |
| Trigger value for risk exposure |
Trigger |
If the risk exposure value becomes "High," then project
personnel will consider implementing a contingency plan. |
| % Frametime |
Measure |
30% |
| %Code Complete |
Measure |
20% |
| Frametime used/code complete ratio |
Indicator |
30% / 20% = 1.5 |
| Trigger value for Frametime used/code complete ratio |
Trigger |
The Frametime used/code complete ratio must be 0.75 when
the code is 45% finished. If it exceeds this value, then a contingency plan
will be implemented. |
Figure Acquired
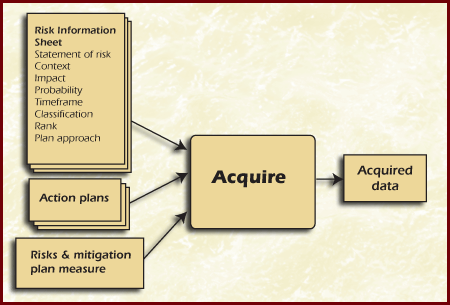
The Table Methods and Tools summarize the approaches, methods, and tools that can be used to acquire risk data.Detailed descriptions of the methods and tools are provided as separate selectable pages in the course outline.
Table Methods and Tools
| Approach |
Description |
Usefulness |
| Re-evaluate risk attributes |
The individual responsible for the risk should
periodically re-evaluate the risk attributes to determine changes in
probability, impact, and timeframe. The following methods are designed to
evaluate risk attributes:
Access to knowledgeable individuals or other data may be required. |
This provides timely communication of potential new risk
areas. This provides status information for watched risk and mitigation plans. |
| Direct communication |
This is informal communication with the personnel closest
to the risk or risk mitigation activity. Often, the software engineers
working on the project or other personnel directly responsible for actions
on the risk or the plan are interviewed. In some cases, the individual who
is interviewed may be the manager responsible for the risk o mitigation
plan. |
This provides timely communication of potential new risk
areas. This provides status information for watched risk and mitigation
plans. |
| Review of technical documentation or engineering summary
reports |
This involves looking at the technical aspects of the
progress of the development effort. |
These reviews can be useful for technical risks but can
also provide insight into general project issues. These can also be used to look for new risk information. |
| Review of status report or meeting minutes. |
This involves a review of documentation available from
the routine protect status meetings. |
These reviews can provide insight into general project
issues. They provide status information for watched risk and mitigation plans. |
| Automated data collection from project products |
This involves using commercially available tools to track
and collect progress and quality measures from the project's products and
reports. |
These tools provide consistent, often quantitative risk
data. The measures collected can be used as indicators to track risks and the progress of mitigation efforts. |
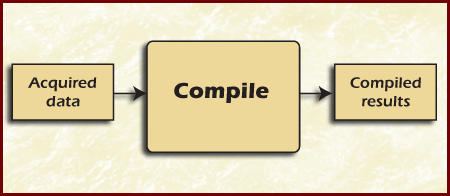
Figure Compile
The report content and format should be driven by the following factors: the tracking requirements of the risk and mitigation efforts as well as the intended audience of the report (e.g., senior managers usually have limited time available and prefer abstracted, summarized reports). The project team members should be aware of data trends and patterns. Trends can be observed through the evaluation-of successive reports. Persistent lateness in taking action, oscillating priority values, significant changes in the number of high-impact risks or risks of a particular type, and other trends should be identified, analyzed, and evaluated for additional negative or positive indicators. These may not be trends that are specifically examined at every opportunity, but patterns that are identified over time and investigated when appropriate. Analysis of trends and patterns can also lead to the identification of new risks to the project. Data Trend Example The following is a data trend example.
| A technical lead
notices an unusual increase in the number of testing-related risks in the
top N project risks during the last three weeks. While it might be
expected that as coding progresses more testing issues will surface,
software coding for this project has not begun. Analysis of the
testing-related risks showed that the test plans, which have been
completed and distributed for review, are perceived to be inadequate. The
technical lead identifies a new risk to the program, which focuses on the
completeness of the test plans. The mitigation plan for the new risk calls
for project personnel to receive more training in the area of software
testing and in the development of test plans. |
The Table Methods and Tools summarize the approaches, methods, and tools used to compile data. Effective approaches include graphic and tabular summaries of the key measures and indicators for risks and their related mitigation actions. Effective summaries also include time history information, which facilitates the identification of trends and variations. Detailed descriptions of the methods and tools are provided as separate selectable pages in the course outline.
Table Methods and Tools
| Approach |
Description |
Usefulness |
| Mitigation plan status summaries |
Plan summaries are reports, which require compiled data
showing mitigation plan progress. Mitigation Status Reports are designed
to track plan status. |
Mitigation status reports employ textual information and
graphics (e.g., time graphs) to document detailed information on specific
risk mitigation plans and are used to support decisions. |
| Risk status summaries |
Summary tables are concise tabular compilations of key
data items. The following methods and tools are designed to produce and
use tabular formats: Risk Information Sheet Spreadsheet Risk Tracking Stoplight Chart The analysis of current status data can identify changes in priority or the need for outside help. It can also identify new risks to the project. |
Risk information sheets are used to document detailed
information on specific risks and to support decisions. Spreadsheet risk
tracking reports are used to summarize the current status of all risks.
They are best used to support routine project activities. Stoplight charts
summarize the status of important risks and their mitigation efforts. They
are effective tools for reporting risk information to senior management. |
| Trend summaries |
Trend summaries arc graphical representations of compiled
risk data. The following are used to present risk data on graphs
or-charts:
Bar Graph Time Correlation Chart Time Graph |
Bar graphs are graphical representations of data across
distinct categories. They highlight changes in the number of risks in
individual categories and can be used to identify trends. Time correlation charts show the relationship of one indicator with respect to another over time. They are useful for identifying the trend over time in the relationship of two indicators. Time graphs are graphical representations of data variations over time. They are useful for identifying the trend over time of an indicator for a risk. They are also used in Mitigation Status Reports. |
Figure Report
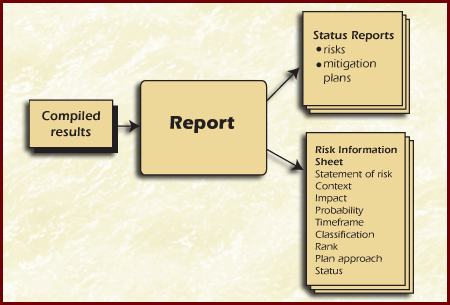
Reports are generally delivered as part of routine project management activities (e.g., as part of a weekly or monthly project status update).A critical event or condition may require exception reporting to management rather than waiting for the next report period. The frequency of reporting depends upon the following:
This is an example of a typical reporting schedule for a project that is several months or years in duration. These time frequencies could vary depending on the criticality of the project.
| On a given project, spreadsheet risk tracking reports are
normally used as read-ahead material for weekly project meetings. They
contain only the important risks. The important risks are those being
watched and planned, as well as new risks. However, once a month, all risks
are included in the report. This gives project personnel the opportunity
to review the less important risks and determine whether any have become
more critical. |
| Also, once a month, senior managers get a stoplight chart
on the top N risks to the project. These charts indicate which risks may
become critical and where senior management decisions are required. |
| |
| Formal presentations of the important risks are made each
quarter to all organizations at a site. This is done to keep other
projects informed of the progress being made. |
Spreadsheet Risk Tracking Spreadsheet risk tracking is a method, which monitors project risks by summarizing and periodically reviewing their statuses. The data for this method are documented in a spreadsheet format. The basic process involves a periodic (e.g., weekly or monthly) update and review of the risks, generally held in conjunction with regularly scheduled project status meetings. Constraints
| Priority | Risk ID |
Risk Statement | Status Comments | Probability | Impact | Assigned To |
| 1 |
22 |
A Satellite Simulator is being developed; impacts to
current project plan and other mitigation plans are unknown but could be
significant - availability of resources to make use of simulator is
questionable |
New risk - resulted from closure of Risk 18. |
H |
H |
Helm |
| 2 |
100 |
Project resources (personnel number and availability) and
schedules were underestimated; schedule slips, cost overruns, reduction in
adequacy of development processes (especially testing time adequacy)
likely. |
New risk 22 has made this worse. Key personnel had
designated back-ups in case availability slips, but Simulator work negates
that.
|
H |
H |
Helm |
| 3 |
23 |
Metrics are being reported only on a quarterly basis;
schedules may slip and recognition of their slip may be too late for
effective Replanning to take place. |
New risk identified by C. Lopez |
M |
M |
Ferris |
| 4 |
7 |
Science requirements have substantial TBDs; late
completion of TBDs likely, with reduction in adequate testing time,
possible science application software failure, incorrect science data
being captured, hardware damage if incorrect safety limits were provided,
extensive rework and substantial cost overruns, mission failure if
problems not found before system is in operation. |
TBD's are being analyzed and researched. Expect
completion of first set next week. |
M |
H |
Helm |
| 5 |
11 |
It has recently been decided that the Infrared sensors
will be developed in-house and how they will communicate and how sensor
data will be processed will be based on assumptions until the detailed
design is baselined; the accuracy and completeness of those assumptions
will determine the magnitude of change in the Instrument Controller CI and
Infrared Sensing Unit CI interface requirements - it could be minor or
catastrophic. |
So far the assumptions we used continue to hold as we
complete prototypes. Only very minor requirement changes have resulted so
far and the ripple has been negligible. |
L |
M |
Helm |
| 7 |
13 |
Waterfall lifecycle model is being used to develop all
software; it may cause serious integration problems between CI and IR
sensor and/or between CI and AA platform leading to a missed launch
window, excessive cost to meet window, or failure to successfully
integrate the system. |
Project plan revised for incremental life cycle.
Recommendation to move to Watch negated by new risk 22. Revisit next
month. |
L |
L |
Lopez |
| . . . |
|
Include the other Top N risks.... |
|
|
|
|
| CLOSED |
2 |
Commercial parts suitability for space applications is
unknown; parts failure may lead to system failure and use of space grade
parts may cause schedule delays since space qualified parts procurement
have a procurement lead time of at least 18 months. |
Commercial parts appear to be working and same
reliability as space qualified parts |
|
|
Ferris |
| CLOSED |
18 |
There is no AA Satellite Simulator currently scheduled
for development; probable that the CSCI will fail when initially
integrated with the actual AA Satellite since prior interface testing will
not have been possible, thus software fixes will be done very late in the
project schedule and may cause the launch date to slip. |
Helm authorized development of simulator on an
accelerated schedule. Project plan must be revisited to enable us to make
use of the simulator. Recommendation to close risk and open a new risk 21,
accepted.
|
|
|
Helm |
| |
|
WATCH LIST
|
|
|
|
|
| W |
101 |
Use of C++, the selected compiler, and OOD are new for
software staff; decreased productivity due to unexpected learning curve
may cause design and coding schedules to slip. |
Training appears to be effective. Only 2 people left to
be trained. Calls to help desk reduced by 80%. Use of expert from ORB
project has been successful. Recommend moving this risk to Watch |
L |
L |
Lopez |
| W |
15 |
The funding and development schedule for the AA satellite
is subject to change and cancellation; IR-SIP schedule slips, cost
overruns, and a reduction in adequate testing time are likely as
unscheduled changes will have to be made to the software to match AA
project changes. |
No change |
L |
H |
Helm |
| |
|
And all other risks, which are not on the top N list and
have not been accepted or closed. |
|
|
|
|
| Approach |
Description |
Usefulness |
| Verbal reporting |
Verbal reports are generally informal. The people
responsible for the risks give verbal reports on the general status of
their risks. They may also use this forum to inform management of critical
issues as they arise (written status would usually be required as a
follow-up).
|
Verbal reports are useful for informal reporting of
status to management and immediate notification of critical issues or
changes.
|
| Written reports |
Written reports may be either formal or informal
memoranda (e.g., electronic mail. reports, etc.). They should be
integrated into the normal status reporting mechanisms used by the
organization. The following can be used for this activity: Mitigation Status Report Risk Information Sheet Spreadsheet Risk Tracking Stoplight Chart |
Mitigation status reports employ graphics to document detailed
information on specific risks and are used to support decisions. Risk information sheets are used to document detailed information on specific risks and to support decisions. Spreadsheet risk tracking reports are used to summarize the current status of all or selected risks. They are best used to support routine project activities. Stoplight charts summarize the status of important risks and their mitigation efforts. They are effective tools for reporting risk information to senior management. |
| Formal presentations |
Presentations use the media and format, which is
appropriate for the organization. Written reports are produced to support
formal presentations.
|
Formal presentations usually contain material that
explains risk management, the status of ongoing mitigation efforts, etc.
This information might not be included in written reports. |
Data Collection Exercise In this data collection exercise you are to think about the type of data you would collect don't just think about cost and schedule but also what to measure.The Table Risk contains the Risks you are to use to collect the data for.
Table Risk
| Risk
|
Data to be Collected
|
| #1This is the first time that the software staff will use OOD; The staff may have a lower-than-expected productivity rate and schedules may slip because of the associated learning curve. | |
| # 20Subset of IR Post Processing CSCI requirements is to be satisfied with COTS products;Integration time and lifecycle costs may increase from original estimates which assumed significant saving from COTS use, leading to schedule slips and cost overruns. | |
| #12Resource availability estimates were overly optimistic- schedule shows all resources are available at the start of each WBS element; schedule slips, cost overruns, and reduction in adequate testing time are likely. | |
Answers
[Air Force 88] Air Force Systems Command/Air Force Logistics Command Pamphlet 800-45. Software Risk Abatement, September 30,1988.
[Baumert 92] Baumert, John H. & McWhinney, Mark S. Software Measures and the Capably Maturity Model (CMU/SEI-92-TR-25). Pittsburgh, Pa.: Software Engineering Institute; Carnegie Mellon University, 1992.
[Grady 87] Grady, Robert B. & Caswell, Deborah L. Software Metrics: Establishing a Company-Wide Program. Englewood Cliffs, N.J.: Prentice-Hall, Inc., 1987.
[Clark 95] Clark, Bill. 'Technical Performance Measurement in the Risk Management of Systems," Presented at the Fourth SEI Conference on Software Risk, Monterey, Ca November 6-8, 1995. For information about how to obtain copies of this paper, contact SEI Customer Relations at (412) 268-5800 or customer-relations@sei.cmu.edu.
[Rosenau 92] Rosenau, Milton D. Successful Project
Management:
A Step-by Step Approach With
Practical Examples. New York: Van Nostrand Reinhold, 1992.