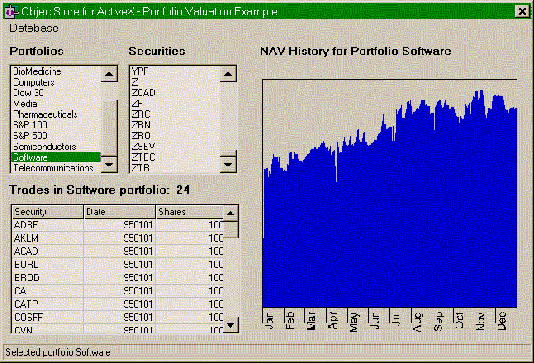
Available portfolios (groups of securities) range from simple industry-sector portfolios (which maintain constant positions in a given list of securities, and thus contain few trades) to complex, large-scale funds containing many trades per day. (The Benchmark portfolio supplied in the sample database contains 20 trades per day over the course of 1995.)
Computing the value of a portfolio over a period of time is typical of financial data management problems involving time series data. The valuation of the portfolio on a given date is a function of the positions held in the portfolio. The number of shares held in each security is a function of the trades that have occurred in that security prior to that date. Essential to optimizing portfolio valuation computations is the ability to efficiently store and rapidly retrieve a value indexed by date.
The sample application includes a small database containing the 1995 trading history of about 600 publicly registered stocks, and a few predefined portfolios. This would not be considered a very large database for a financial institution, yet it is large enough to illustrate the performance demands of this domain. The objective of the sample application is to provide interactive performance, meaning apparently instantaneous computation and display of portfolio valuations. You must take reasonable care in the design of the data representations to attain this. The OSAX server architecture implements critical computations in C++ and presents the results to Visual Basic for graphing and display. This is a good example of partitioning an application to use the respective strengths of each language.
With OSAX installed in the default location on your computer, the Portfolio sample application is in the following directory:
c:\odi\osax\examples\portfolio
Once the list boxes are populated, selecting any security displays a graph of that security's price history over 1995. Selecting any portfolio computes and graphs the Net Asset Value (the y-axis) of the portfolio over 1995 (the x-axis). If you select the name of a security in the Securities list, the graph reflects the trade volume just in that security rather than the entire portfolio.
In the lower left corner of the screen is a data display showing the trades associated with the selected portfolio. The first column lists the security ID, the second lists the date (in the form yymmdd for year, month, day), and the third lists the number of shares traded.
You implement these data types in C++ and they are exposed to Visual Basic through an OLE type library. The type library is generated from the Portfolio database schema. You can load the OLE type library corresponding to the database schema into Visual Basic and inspect it using its Object Browser.
Implementation of the Portfolio Sample Application
The Portfolio sample application contains an object server implemented by a Visual C++ project. It also contains several different client applications written in different dialects and configurations of Visual Basic. The source code for all these projects is provided in the .\examples\portfolio directory. Visual Basic Implementation of the Application
The Portfolio sample application uses the following Visual Basic components:
Implementation of the Object Server
The following table describes the object model for the Portfolio database.
The Portfolio sample application is provided in .\examples\portfolio\. It includes the files listed in the Portfolio ReadMe.txt file.
Updated: 03/18/98 13:56:22