Activity Bar Chart
An
activity bar chart is another way (in addition to the activity network
diagram) of visually rendering the dependencies (or lack thereof) between the
various project tasks. This type of chart is often referred to as a
Gantt chart.
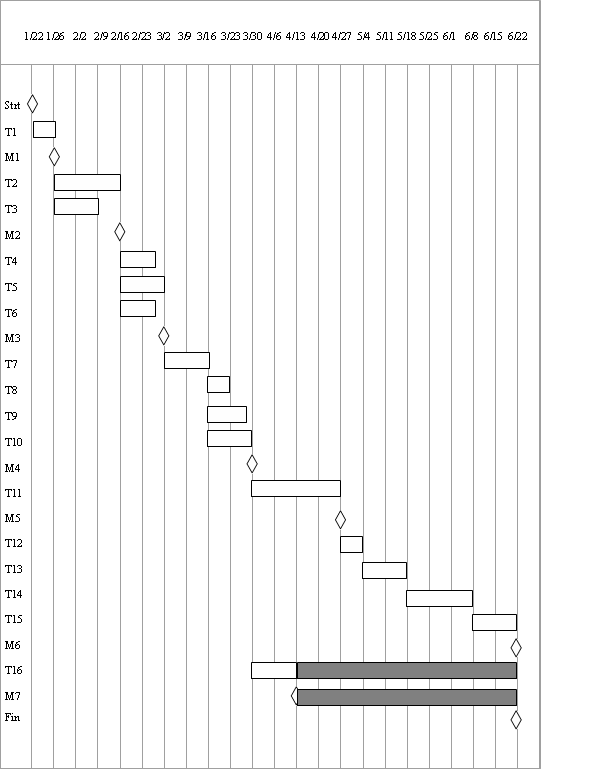
The activity network diagram is an effective format for easily identifying the critical path so that project management can shorten that path as much as possible. By contrast, an activity bar chart is an effective format for clearly identifying schedule slips as they relate to the various milestones (or inchstones for finer, sub-task level scheduling granularity).
The following activity bar chart (Gantt chart) shows the durations and dependencies of the tasks that precede the testing phase for the microwave oven example.

The
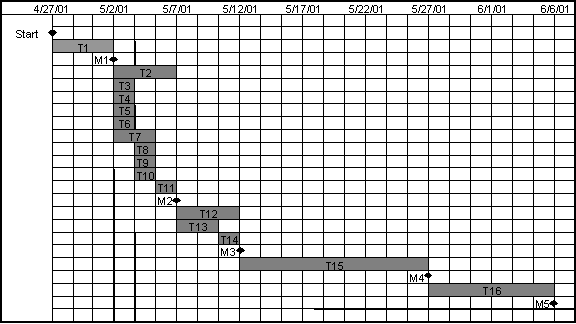
following activity bar chart (Gantt chart) shows the durations and
dependencies of the tasks that are performed during the testing phase for the
microwave oven example.
