Activity Network and Milestone Description
Activity
network diagrams help project managers to identify dependencies and
critical paths. Identifying critical paths is important in regards to
allocating resources in an optimal fashion. Any schedule slip on the
critical path directly translates to a project-wide schedule slip and
should therefore be avoided.
Activity network diagrams also help to identify independent activities which can be executed simultaneously. An analogy follows: Just as it is important for a computer system to schedule work in parallel to optimize resources, it also important for a project to have work scheduled in parallel to optimize the use of available project resources (especially schedule time).
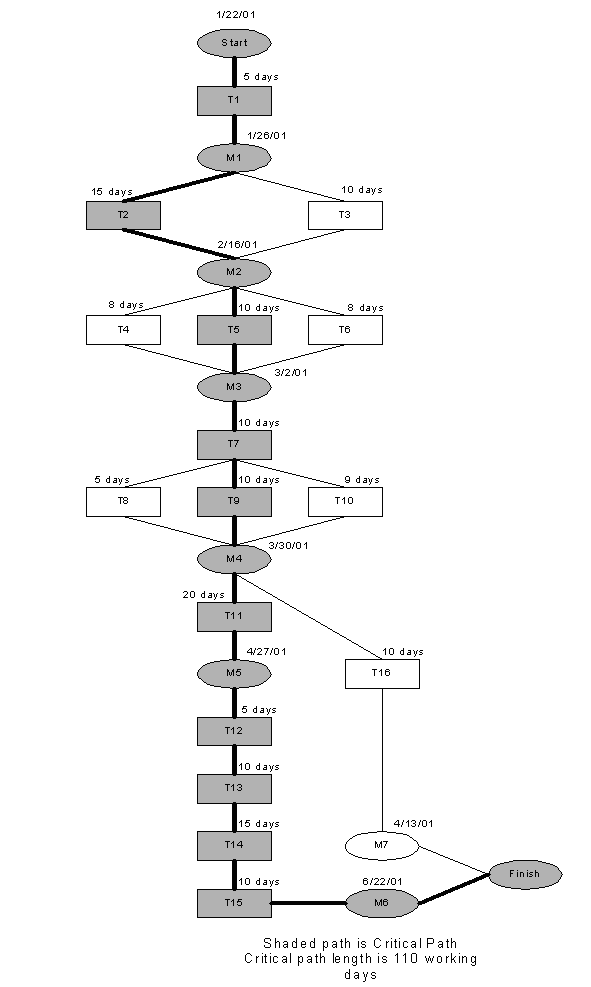
The following activity network diagram models the tasks (along with their dependencies) for the activities that precede the testing phase for the microwave oven example.
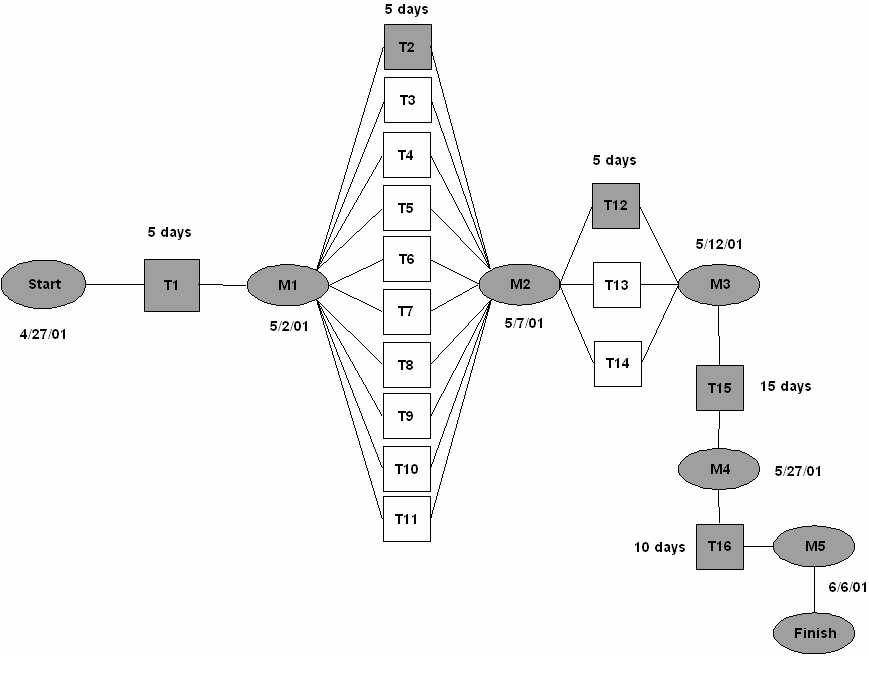
The following activity network diagram models the tasks (along with their dependencies) for the activities that occur during the testing phase for the microwave oven example.
Activity network diagrams also help to identify independent activities which can be executed simultaneously. An analogy follows: Just as it is important for a computer system to schedule work in parallel to optimize resources, it also important for a project to have work scheduled in parallel to optimize the use of available project resources (especially schedule time).
The following activity network diagram models the tasks (along with their dependencies) for the activities that precede the testing phase for the microwave oven example.
Activity network diagram

| Milestone | Description |
| M1 | A concept document will be generated. Completion of this document indicates that the milestone has been reached. |
| M2 | A project plan and project schedule will be generated. Completion of these two items indicates that the milestone has been reached. |
| M3 | A Software Requirements Specification will be generated. Completion of this document indicates that the milestone has been reached. |
| M4 | A Software Design Document will be generated. Completion of this document indicates that the milestone has been reached. |
| M5 | A Fully Functional System Software will be generated. Completion of this software indicates that the milestone has been reached. |
| M6 | An Acceptance Test Report will be generated. Completion of this test indicates that the milestone has been reached. |
| M7 | A User’s Manual will be generated. Completion of this manual indicates that the milestone has been reached. |
The following activity network diagram models the tasks (along with their dependencies) for the activities that occur during the testing phase for the microwave oven example.
Activity network diagram

| Milestone | Description |
| M1 | A report will be generated following the Unit Testing Process. Completion of Unit Test Report indicates that the milestone has been reached. |
| M2 | A report will be generated at the conclusion of the Module Testing Process. Completion of the Module Test Report indicates the milestone has been reached. |
| M3 | A report will be generated at the conclusion of Sub-system testing. Completion of the Sub-system Test Report indicates the milestone has been reached. |
| M4 | A report will be generated at the conclusion of System testing. Completion of the System Test Report indicates the milestone has been reached. |
| M5 | A report will be generated at the conclusion of the Acceptance Testing process. Completion of the Acceptance Test Report indicates that the final milestone has been completed. |