Lets go back and visualize Roger L Van Scoy's paradigm [Van Scoy 92, p.9] and what he said about the control element. To refresh your memory, Van Scoy said:
"Risk control is the next element in our paradigm. Once the risk metrics and the triggering events have been chosen, there is nothing unique about risk management. Rather, risk management melds into program management and relies on program management processes to control the risk action plans, correct for variations from the plans, respond to triggering events, and improve the risk management process. In fact, if risk management is not integrated with day-to-day program management, it will soon be relegated to an ineffective background activity."
The paradigm illustrates a set of functions that are identified as continuous activities throughout the life cycle of a project. The Control function is highlighted in Figure Control Risk Management Paradigm.
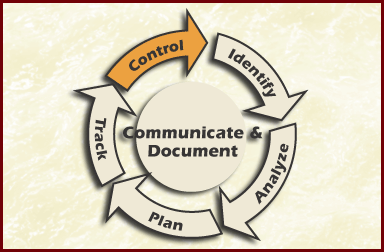
Figure Control Risk Management Paradigm
The Control function is the process that takes the tracking status reports for the watched and mitigated project risks and decides what to do with them based on the reported data. The person who has accountability for a risk normally makes the control decision for that risk. The general process of controlling risks includes the following:
The objective of the Control function is to make informed, timely, and effective decisions regarding risks and their mitigation plans. The Figure Control shows the inputs and outputs of the control function. The Figure Control demonstrates the activities of Tracking and Control and how closely they relate. When doing risk management, these activities are often combined. Control is where and why metrics are used. It is a natural flow from tracking.
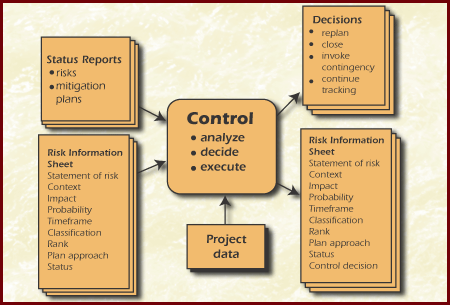
Figure Control
The Table Control Function describes the data items of the control function. The outputs are actually decisions and their related products.
Table Control Function
| Data Item |
Description |
| Status report
|
A variety of status reports are used to highlight the current values of the risk indicators and the statuses of action plans. These reports can be verbal or written, covering the statuses of both individual risks and aggregated risk areas as appropriate. |
|
Prior to the Control function, the risk information for each risk comprises the statement of risk, supporting context, impact, probability, timeframe, class, rank, plan approach, and status. This could be for all of the risks or for a small subset of risks targeted for risk control. |
| Project Data |
Project information, such as schedule and budget variances, critical path changes, and project/performance indicators can be used to support decision making where appropriate. This data can be considered when project personnel make control decisions. |
| Decisions
|
The output of the Control function is a decision that determines the next action for the risk or set of risks under consideration. There are four possible decisions;
|
|
In addition to making a control decision, the Control function updates the information associated with each risk to include the current control decision for the risk (i.e., replan, close the risk, invoke a contingency plan, and continue tracking and executing the current plan). |
Effective control requires anticipating and assessing the effectiveness of mitigation plans as well as monitoring the quality of executing the plans (i.e. Are the plans being executed correctly? Are the results what were expected?). It also involves assessing significant changes in risks (e.g., changes in their attribute values).
Effective control therefore requires:
Risk control is related to standard project management monitoring techniques. These methods use project measures, such as schedule and cost metrics, for tracking, and decisions are based on the acquired data. Controlling risks is a process step that should be easily integrated and coordinated with the routine activities associated with management decision-making processes already established within the project.
Table Risk Information Sheet
| ID |
Risk Information Sheet Plan |
Identified: |
||||||
| Priority Probability Impact |
Statement |
|||||||
| Timeframe |
Originator |
Class |
Assigned To: |
|||||
| Context
|
||||||||
| Approach: Research / Accept / Watch / Mitigate Contingency Plan and Trigger |
||||||||
| Status |
Status Date |
|||||||
| Approval __________________________ |
Closing Date __/__/__ |
Closing Rationale |
||||||
The risk management team will use the risk information sheet to indicate what information will be gathered during control. The shaded areas indicate the fields that will be completed during control:
This shaded areas of the risk information sheet only deals with a decision to close the risk. Invoking a contingency plan and replanning would be noted in the status section of the risk information sheet. A decision to continue tracking and executing the plan is not necessarily noted on the risk information sheet.
During risk identification and analysis, risks that are related should be grouped together for easier management. For such sets, risk and mitigation plan status data are reported as an aggregate. Project personnel use the reports generated in tracking to make informed, timely, and effective decisions regarding sets of risks and their mitigation plans. he reports are analyzed and evaluated, and decisions are made and executed. When a set of risks is being analyzed and its trigger is reached, a decision should be made whether to look at individual risks. Any specific problems should be identified and addressed as appropriate.
The Table Control Methods and Tools summarize the methods and tools used to support risk control activities. Methods employed for risk control use basic techniques for analyzing and deciding on an action, documenting the decision, and proceeding with the chosen actions. Most organizations have an established suite of effective methods for such activities. If these techniques do exist within an organization, then they should also be applied to risk status information.
Table Control Methods and Tools
| Activity |
Control Methods and Tools |
| Analyze |
|
| Decide |
|
| Execute |
Spreadsheet risk tracking
Making changes to plans requires a return to planning, while taking predefined contingency actions and continuing to track risks requires a return to tracking. |
The Analyze activity uses tracking data to examine project risks for trends, deviations, and anomalies. The goal is to achieve a clear understanding of the current status of each risk and mitigation plan relative to the project. The objective of the Analyze activity is to provide information needed by decision makers to accurately determine the best courses of action for project risks. Decision makers need to know if there is a significant change in risks or if mitigation plans are ineffective within the context of project needs and constraints. The Figure Analyze shows the inputs and outputs for analyzing risks.
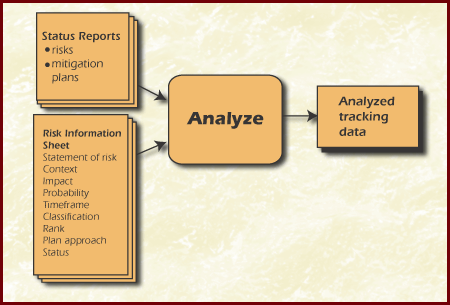
Figure Analyze
The project metrics that are collected and analyzed are documented in the risk management plan. Trend and data analysis of project metrics can be used to identify new risks to the project. Patterns may be identified over time and are investigated when appropriate. Analysis of trends and patterns can also lead to the identification of new risks to the project. After a new risk is identified, it is analyzed. If its priority is high enough, it is added to the project's Top N list. Trends can be observed through the evaluation of successive reports, which show:
The Risk ID 6 gave the risk team a concern about inadequate test resources and schedules.
| #6 - Project software schedule and resources were underestimated; Schedule slips, cost overruns, and a reduction in adequate testing time are likely results. |
For this risk the completion of component unit testing over time is a metric that will yield insight into controlling this risk. The time period used is to compare Actual vs. Projected values to examine schedule concerns. The trend analysis example shown in Figure Trend Analysis is concerned with component completion rates. These components could be software or hardware components. A component is considered completed after it has been unit tested. Components should be completed prior to the start of integration testing.
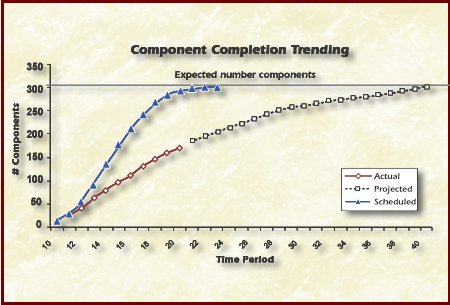
Figure Trend Analysis
The line at the top of this graph indicates the expected total number of components, and the solid curved line represents the expected rate of component completion. However, Actual component completion rate is much less than expected. Monitoring the rate of completion helps determine whether there will be sufficient testing within the allotted schedule.
The slope of the completed line should be steep during coding and completed by testing as indicated by the expected line. This means that modules would be completed during coding. The graph indicates that many modules were being coded during testing. Furthermore, module completion is estimated to end at week 40, according to the graph. The coding phase was supposed to end after week 20. Thus, effort that should have been used for testing was spent in coding. Testing may not be completed on time, and some functionality might be shifted to the next build.
New risks concerning both the completion of testing and the functionality of the software might be identified from this analysis.
Many risks concerns came from Requirements Instability and/or Incompleteness. Risk # ID 7 was specifically concerned with the TBDs. The risk team must decide which metrics should be used in controlling this risk concern.
| ID 7 - Science requirements have substantial TBDs; late completion of TBDs likely, with reduction in adequate testing time, possible science application software failure, incorrect science data being captured, hardware damage if incorrect safety limits were provided, extensive rework and substantial cost overruns, mission failure if problems not found before system is in operation. |
The risk team therefore needs to know when requirements are both complete and stable. These two term are defined by:
The requirements completeness and stability are expected prior to CRR (Critical Requirements Review).
The graph in Figure Total Number of Requirements tracks the total number of requirements. The leveling trend says nothing about completeness (elimination of TBDs). It only indicates the total number has stabilized, since few requirements are being added or deleted.
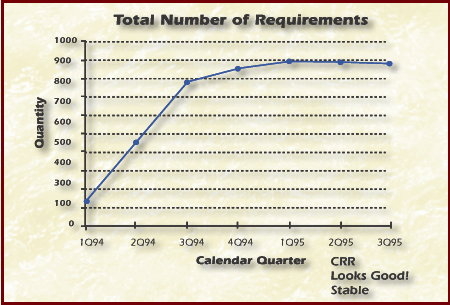
Figure Total Number of Requirements
The graph Figure Modification to Requirements shows the numbers of additions, deletions, and modifications. It shows that excessive modifications are still taking place, even though there are no new and few deleted requirements. There is requirements volatility in Quarters 2 & 3.
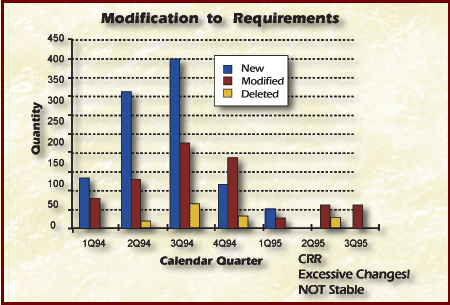
Figure Modification to Requirements
The conclusion is that multiple metrics might be required to give insight into what is really happening. Completeness must be addressed separately. Meanwhile, a risk concerning requirements volatility could be identified from this analysis.
The Table Analyze Methods and Tools summarize the methods and tools that can be used to analyze tracking data. Virtually all-general methods for information analysis can be used during this activity. Detailed descriptions of the methods and tools are provided in the appendix.
Table Analyze Methods and Tools
| Method or Tool |
Description |
| Analyzing the causes and effects of risks and actions may provide additional insight into their dependencies and relationships to support decisions. For example, this method can help to determine the merits of continuing with a current set of mitigation actions. |
|
| The costs and benefits of a particular mitigation strategy can be re-evaluated if the strategy is not having the expected results. This method provides the information needed by decision makers to determine whether to continue as planned or to replan. |
|
| These reports use a visual method for tracking risks. In this technique, risk exposure is tracked over time, and both the value of risk exposure and its trend are used as indicators. This method provides decision makers with the data required to determine the appropriate control actions (e.g., invoke contingency plan, replan, etc.). |
|
| These dependency and probability schedules can be used to analyze the impacts of changes in risk status and mitigation plans. For example, the effect on a project's critical path from a significant increase in the time to complete a critical system component can easily be determined from a PERT Chart. |
|
| Current and historical tracking information is provided by a spreadsheet showing major changes and significant trends. Adverse trends or changes can be highlighted, and thresholds that are reached can also be identified (e.g.. estimated impact of an unmitigated risk exceeds $10,000). |
|
| Senior managers can use these abstract-level status reports to determine whether or not they need to take action. Red, for example, may indicate that senior management action is required for a risk or set of related risks. |
The Decide activity uses tracking data to determine how to proceed with project risks. Four basic decisions can be made:
The objective of the Decide activity is to ensure that project risks continue to be managed effectively. Contingency plans should be implemented as soon as indicators show that they are needed. Replanning also must be completed in a timely manner to correct deviations and to avoid further potential loss.
The Figure Decide shows the inputs and outputs for making control decisions.
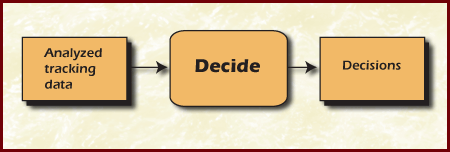
Figure Decide
The Table Decision describes the decisions that can be made, lists the consequences of those decisions, and gives supporting examples. The management action choices are from the simplest to most complex. Contingency plans should be implemented as soon as indicators show that they are needed. Replanning must also be completed in a timely manner to correct deviations and to avoid further potential loss. If a budget is required for contingency action implementation (which should be specified), then check the project allocation for contingencies. Some project replanning may be required if sufficient funds for contingencies were not allocated.
Table Decision
| Decision |
Description |
Example |
| A closed risk is one that no longer exists or is no longer cost-effective to track as a risk. This occurs when the probability has been reduced below a defined threshold the impact has been reduced below a defined threshold the risk has become a problem and is now tracked as such. Closure of a risk requires the agreement of all affected parties. |
Three months into coding, 100% of the development personnel are trained on the new compiler. There are no plans to bring new personnel on the project as new hires or transfers, and there are no other expected changes in personnel. Management feels that morale is good enough to allow this risk to be closed. |
|
| Continue tracking and executing the current plan |
No action is taken when the analysis of the tracking data indicates that all is going as expected and when project personnel decide to continue tracking the risk or mitigation plan as before. |
Three months into coding, 95% of the necessary development personnel are trained. However, the plan calls for an additional 27 developers to be hired or transferred in the next two months. The new developers are largely untrained in the new compiler, and the decision is made to continue with the mitigation efforts and to track the risk. |
| Replan |
A new or modified plan is required when the threshold value has been exceeded analysis of the indicators shows that the action plan is not working an unexpected adverse trend is discovered |
Despite efforts to get development personnel trained on the new compiler, the project is 35% short on trained personnel three months into the coding phase. The project manager asks for revisions to the mitigation plan to avoid a schedule slip. Close a risk |
| Invoke a contingency plan |
A contingency plan is invoked when a trigger has been exceeded or when some other related action needs to be taken. The risk and its mitigation plan continue to be tracked after the contingency plan has been executed. |
A contingency training plan was developed to bring short, ' intense (and expensive) compiler training on site if needed. With a 35% shortfall in trained personnel three months into coding, the decision is made to conduct the special training in-house. |
Decision Example
The Figure Time Graph is an example of a Time Graph from a Mitigation Status Report.
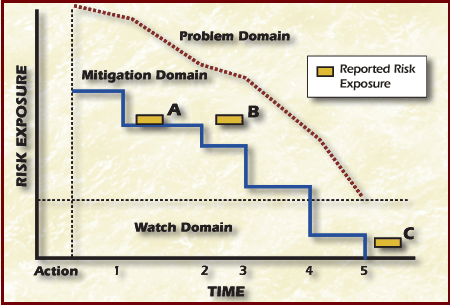
Figure Time Graph
By examining the graph the following decisions can be made at points A, B, and. C:
Point A: The risk exposure has been reduced as expected after Action I. Project personnel will continue tracking the risk.
Point B: Either the risk exposure has not been reduced after Action 2 or the action did not occur as scheduled. There may be a need to replan or to invoke a contingency plan if one is available. Project personnel must ultimately rely upon their experience and knowledge when making decisions.
Point C: The risk exposure has been reduced below a predefined threshold after Event 5. The risk can be closed.
The Table Decide Methods and Tools summarize the methods and tools that can be used to make control decisions.
Table Decide Methods and Tools
| Methods and Tools |
Description |
| Closed risks need to be documented, lessons learned incorporated, and appropriate personnel notified. |
|
| This is used to reduce the number of options to an optimal few. |
|
| This voting technique is used to choose a solution from a number of alternatives. |
The Execute activity is the process where control decisions are implemented. If the decision is to take a planned action, then either the action is executed or the contingency plan is implemented, and the risk and its associated mitigation plan continue to be tracked. All closed risks should be documented along with the rationale for closure. However, when a decision is made to continue tracking a risk, it generally does not require documentation. Making changes to plans requires a return to the Plan function, while taking predefined contingency actions and continuing to track risks requires a return to the Track function. The objective of the Execute activity is to implement both the decision made about a risk and mitigation plan as well as to ensure that all decisions are appropriately documented for future reference and historical record maintenance. The Figure Execute shows the inputs and outputs for executing decisions.
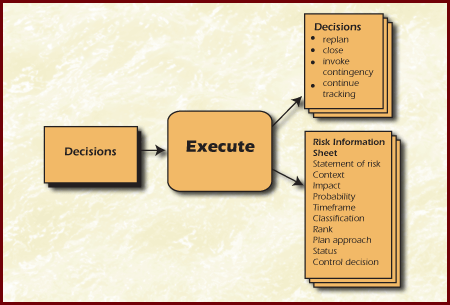
Figure Execute
These are several considerations need to be made when closing risks:
The lessons learned from watching or mitigating a risk or set of risks and the rationale for closing it should be captured upon closure. This information may be relevant to the present project or to other projects within the organization.
The following list contains examples of the types of lessons learned that should be retained:
If a closed risk has to be reopened at a future time, there should be a process in place indicating how to handle the situation. Either the old risk should be reopened or a new risk that references the old one should be opened. Important information and trends can be lost if the linkages are not maintained.
A mitigation status report is a means of assessing and evaluating mitigation plans on a periodic basis. It may use graphics to display risk indicators and also contains written information on the status and the causes of the risk or risk set. The format of the report and the information included in the report should be tailored to the needs of each organization. Ideally, this technique should visually display risk indicators to allow project personnel to make control decisions:
Mitigation status reports take time and effort to be properly structure and maintained. However, the periodic updating of the information on the reports requires modest effort. This method or tool is best used for top N risks with detailed mitigation plans. Mitigation status reports are used only for mitigated risks.
A mitigation status report contains information that the risk team can use to make control decisions about a risk. A mitigation status report contains both textual and graphical information about a risk and its mitigation plan.
The textual information in the mitigation status report can include:
The graphical information in the mitigation status report can include:
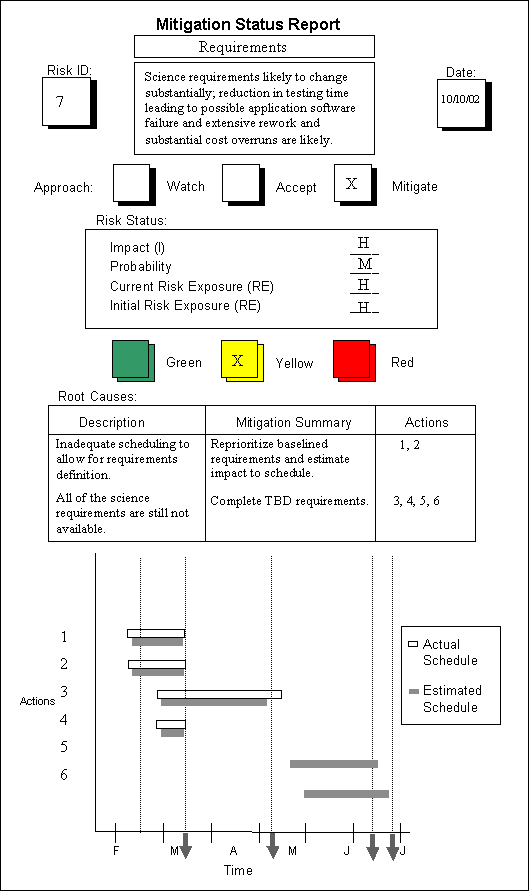
Figure Mitigation Status Report
The Table Risk Information Sheet After Control is an example of the Risk Information Sheet for Risk #11at the end of the Control activities.
Table Risk Information Sheet After Track and Control
| ID 11 |
Risk Information Sheet |
Identified: _8/01/02_ |
||||||
| Priority Probability Impact |
7 M M |
Statement It has recently been decided that the Infrared sensors will be developed in-house and how they will communicate and how sensor data will be processed will be based on assumptions until the detailed design is baselined; the accuracy and completeness of those assumptions will determine the magnitude of change in the IR-SIP Instrument Controller CI and Infrared Sensing Unit CI interface requirements - it could be minor or catastrophic. |
||||||
| Timeframe |
N |
Originator J. Helm |
Class Requirements |
Assigned To: A. Henry |
||||
| Context The AA program is in the Systems Preliminary Design Phase and the project software is in the Software Specification Phase.
|
||||||||
| Approach: Research / Accept / Watch / Mitigate Mitigation goal/success measures: Reduce the probability and impact of incorrect interface assumptions to a minimum: estimated low probability and low impact. Ideally, completion of prototype tests will show that assumptions we got from Easy Sensor were correct and there is no impact at all.]
|
||||||||
| Contingency Plan and Trigger
|
||||||||
| Status |
Status Date |
|||||||
| Interface tests in progress - no significant difficulties found so far. Expected completion of tests on 10/26 |
10/20/02 |
|||||||
| Second prototype complete |
10/7/02 |
|||||||
| Testing of the interface complete, ran a bit late but no significant difficulties found with the interface |
10/4/02 |
|||||||
| First prototype complete |
2/1/03 |
|||||||
| Approval __________________________ |
Closing Date __/__/__ |
Closing Rationale |
||||||
The Table Execute Methods and Tools summarize the methods and tools used to document decisions, which have been executed.
Table Execute Methods and Tools
| Methods and Tools |
Description |
| Closed risks need to be documented, lessons learned incorporated, and appropriate personnel notified. |
|
| Documentation of the contingency actions taken is added to in the status report. The time graph will need to be redrawn. |
|
| The risk information sheet is updated to reflect the implementation of a contingency plan. |
|
| Documentation of the action being executed and other relevant information such as the scheduled completion date is added to the spreadsheet. |
|
| Documentation of the action being executed, its current state of success, and other relevant information such as the schedule completion date is added to the chart. |
Control decisions are based on available information as well as experience and are required to respond to changing conditions in watched and mitigated risks. Decision-making is a complex process. When decision-makers make decisions, they use their experiences and intuition in addition to the data acquired and compiled for them. Because conditions often change, watched and mitigated risks can change. Control decisions are necessary to respond to changing conditions.
Tips and Guidelines:
[Arrow 88] Arrow, Kenneth J. "Behavior Under Uncertainty and its Implications for Policy," 497-507. Decision Making: Descriptive, Normative, and Prescriptive Interactions. Cambridge: Cambridge University Press, 1988.
[Boehm 89] Boehm, Barry. IEEE Tutorial on Software Risk Management. New York: IEEE Computer Society Press, 1989.
[Clark95] Clark, Bill. "Technical Performance Measurement in the Risk Management of Systems," Presented at the Fourth SEI Conference on Software Risk, Monterey, Ca November 6-8, 1995.
[Rosenau 92] Rosenau, Milton D. Successful Project Management: A Step-b)> Step Approach With Practical Examples. New York: Van Nostrand Reinhold, 1992.
[Scholtes 88] Scholtes, Peter R. The Team Handbook: How to Use Teams to Improve Quality. Madison, Wi.: Joiner Associates, Inc., 1988.
[Xerox 92] Xerox Corporation and Carnegie Mellon University. The University Challenge: Problem-Solving Process User Manual. Stamford, Ct.: Xerox Corporation, 1992.